Viewing Graphs
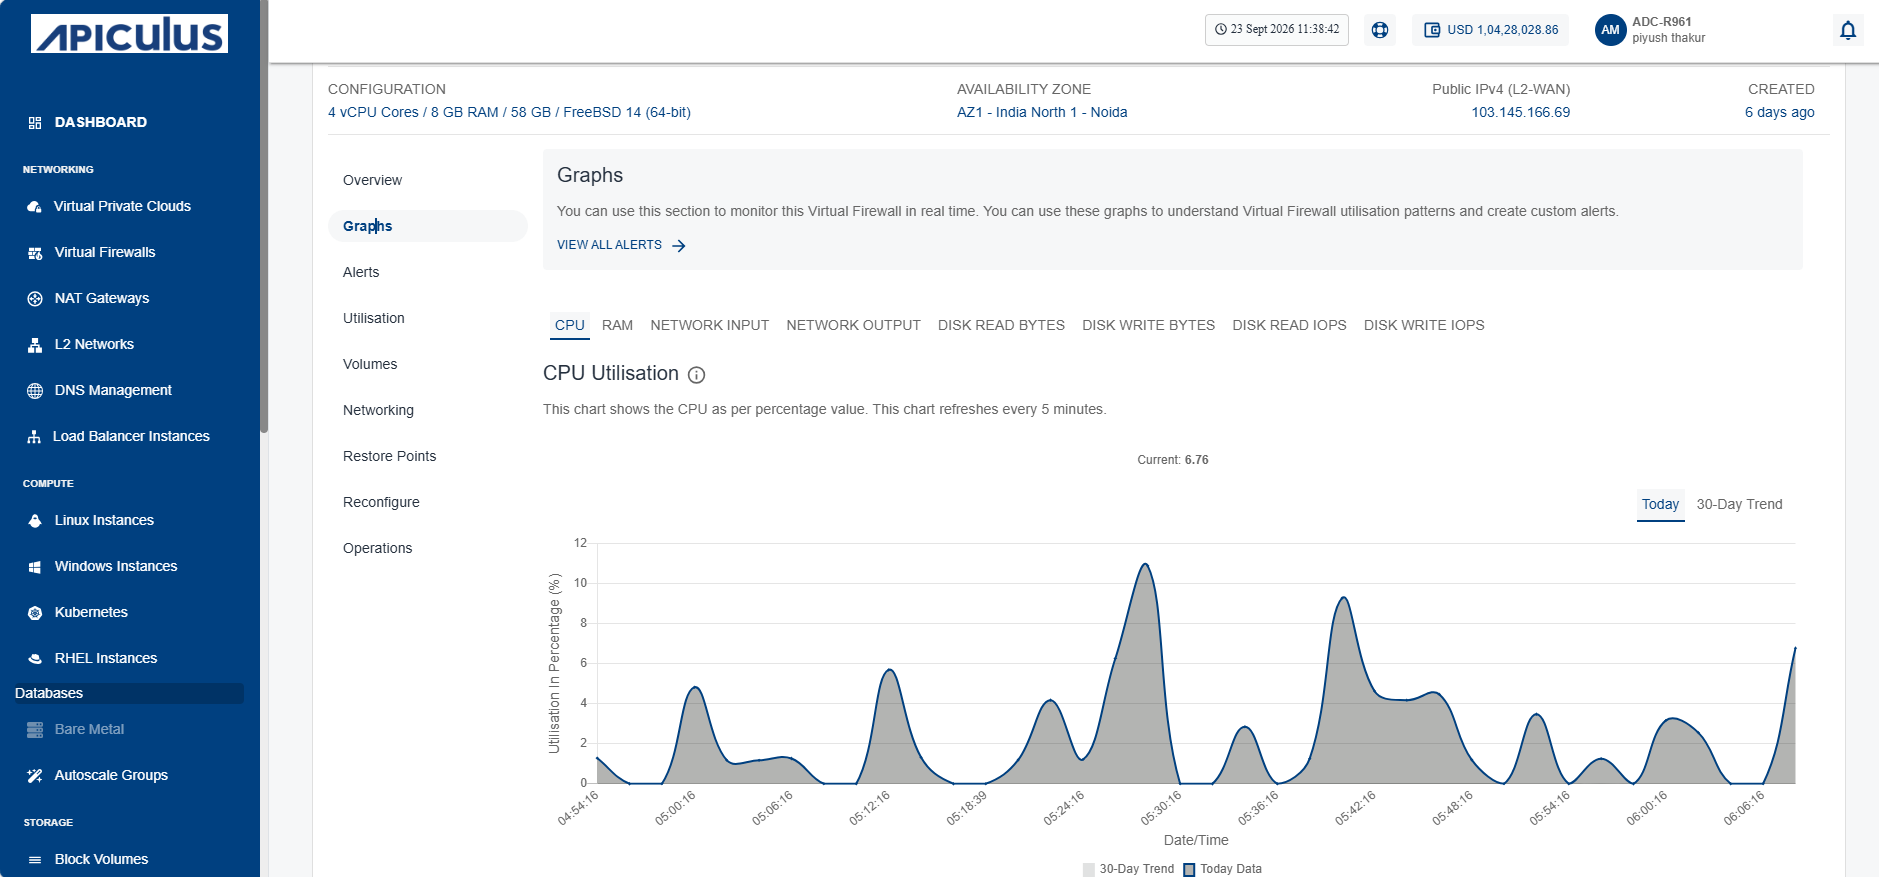
Graphs display key performance metrics of your Virtual Firewall instance. You can view CPU, RAM, network traffic, and disk activity on a 24‑hour time scale with a 30‑day trend line. Graphs help you track utilization patterns and configure custom alerts to manage performance effectively.
To view the available graphs and monitor the instance in real-time, follow these steps:
- Navigate to Networking > Virtual Firewalls. The following screen appears:
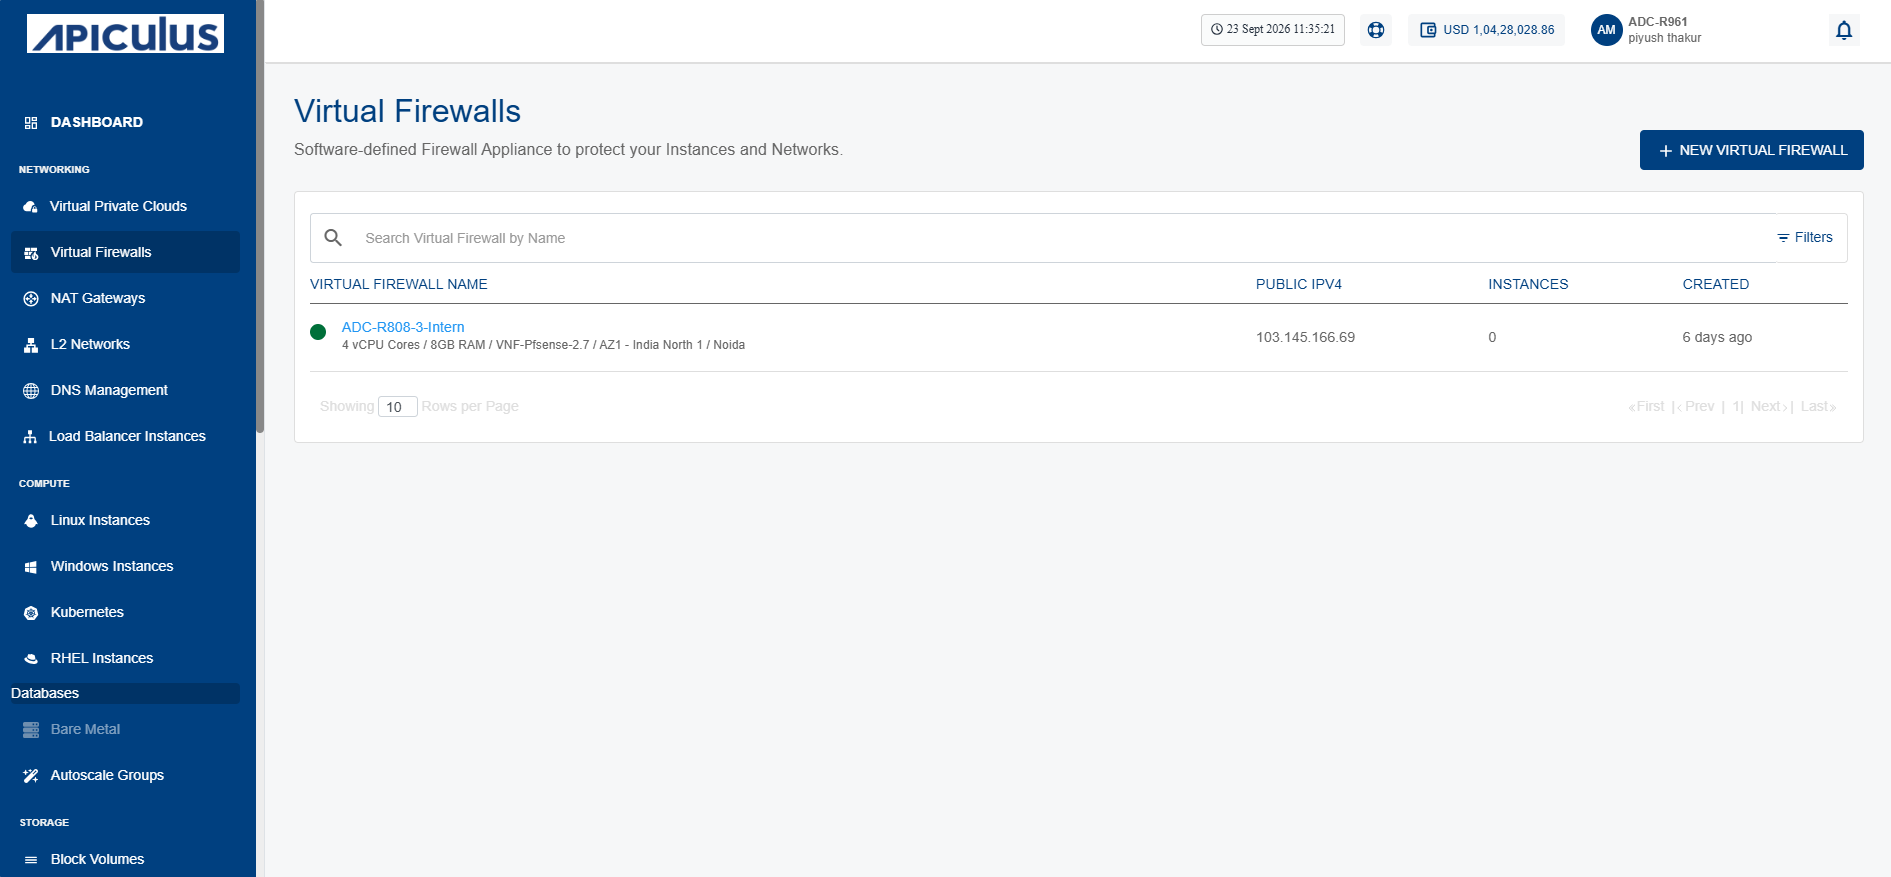
- Click on your created virtual firewall name from the list.
- Click Graphs. The following screen appears: