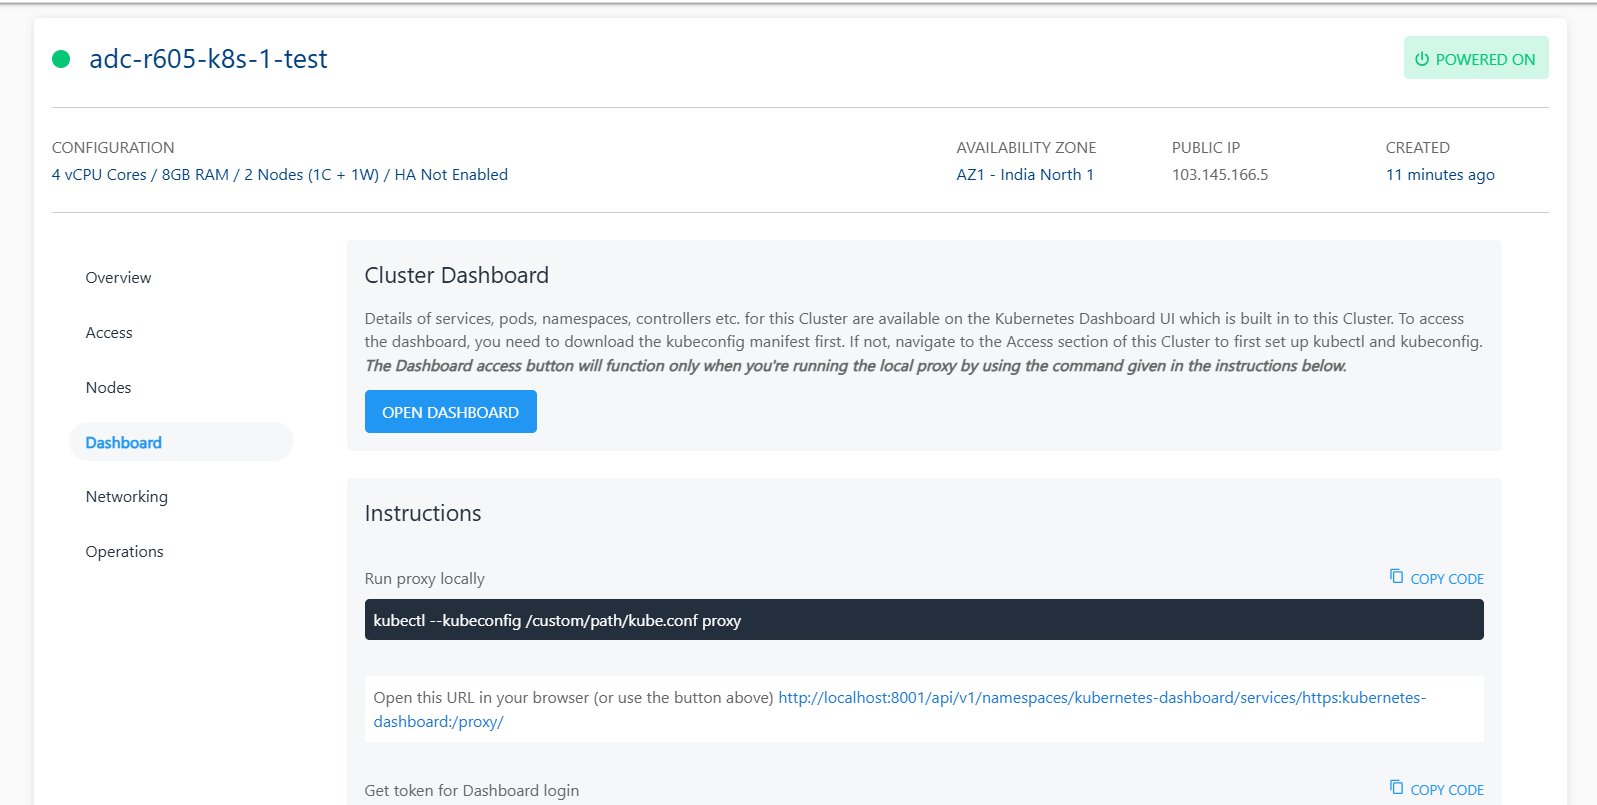
Cluster Dashboard
The Kubernetes Dashboard is a web-based user interface that provides a visual representation of a cluster's resources and enables easier management and monitoring. Here's an overview of the dashboard:
- Features: The dashboard displays various cluster resources, such as pods, services, nodes, deployments, and more. It offers an interactive view of the cluster's current state.
- Access Control: Access to the dashboard is subject to RBAC (Role-Based Access Control) policies. Users need appropriate permissions to view and modify resources.
- Monitoring: While the dashboard provides essential monitoring, more comprehensive monitoring solutions like Prometheus and Grafana can be integrated for in-depth insights.

Details of services, pods, namespaces, controllers etc. for a Kubernetes cluster are available on the Kubernetes Dashboard UI. To access the dashboard, the kubeconfig manifest needs to be downloaded and used.
If not, navigate to the Access section of a cluster to first set up kubectl and kubeconfig.
Once done, a local proxy needs to be run using the command given below:
kubectl --kubeconfig /custom/path/kube.conf proxy
If everything is set up correctly, opening this URL ) in your browser or use the OPEN DASHBOARD button in the Dashboard section of cluster details.
Each Kubernetes cluster has its own dashboard.
Getting Token for Dashboard Login
To login to the cluster dashboard, a token needs to be obtained which can be done using the following command on the CLI:
kubectl --kubeconfig /custom/path/kube.conf describe secret $(kubectl --kubeconfig /custom/path/kube.conf get secrets -n kubernetes-dashboard | grep kubernetes-dashboard-token | awk '{print $1}') -n kubernetes-dashboard
More information about accessing the Kubernetes Dashboard UI can be found here